Week 7: 8th May - 15th May
Planetary science: Lunar in-situ transects
Marine science: Online marine data archives
Selecting a personal project
Week 7: Planetary science: Analysis of rover transects on the Moon
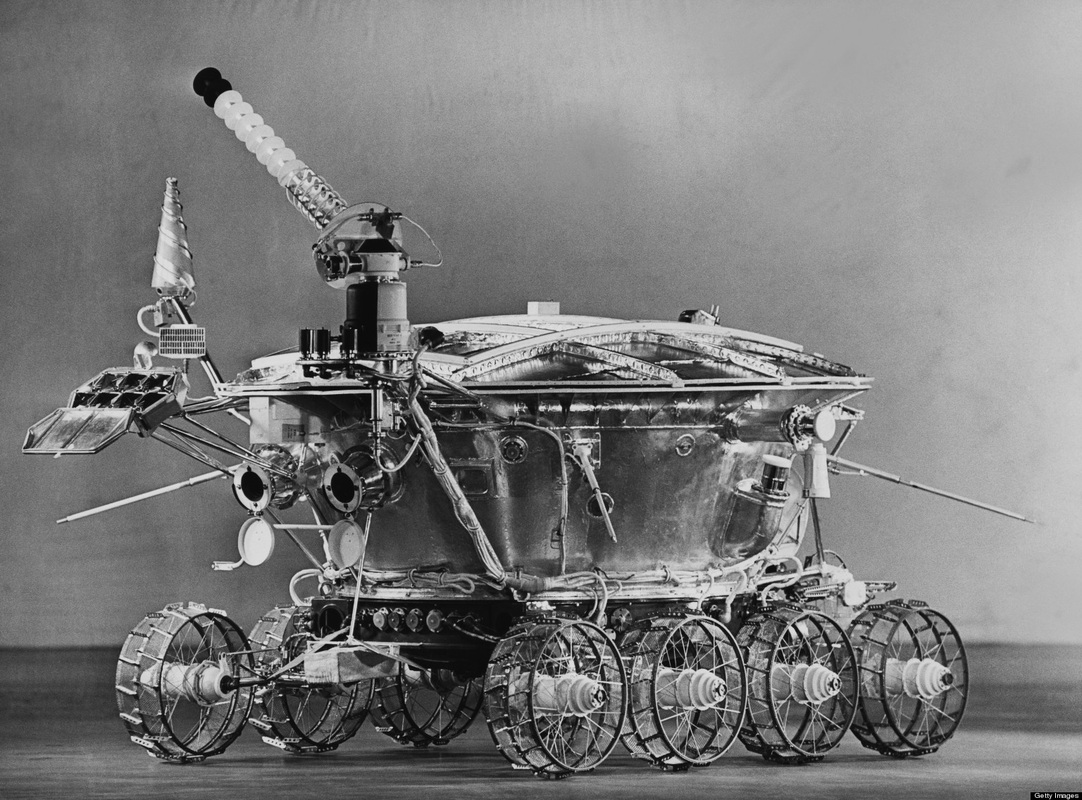
Three countries managed to bring rovers to the Moon: Russia, China, and the United States. The first fully automated rover on the Moon was Lunokhod 1 in 1970. The mission lasted nearly for one year and the rover traveled 10.5 km on the lunar surface. Lunokhod 2 was a more advanced rover that landed three years later on the lunar surface. The rover operated for 4 months and covered incredible 42 km during that time. The Chinese rover Yutu is sitting on the lunar surface since December 2013 and is still collecting useful data, but lost the ability to travel after 2 weeks of the mission. Several rover missions are planned for the Moon in the future.
Within the last 40 years rovers got more and more advanced. The Lunokhod 1 rover can hardly keep up with the instrumentation on Curiosity (Mars 2012). Higher resolution cameras, drilling equipment, and an on board laboratory are included in some rovers from today. Rovers still do not cover large areas, but they provide unique information along the rover track. The advantages for rover missions after all are the probing and in situ research on the surface to obtain results, no remote sensing method could achieve.
We will focus on the Lunokhod 2 mission. It operated from January to May 1973. The rover was maneuvered in real time by a team on Earth. They analyzed incoming imagery and sent driving commands back to the Moon. The rover was equipped with various instruments.
The position of the rover is known as it was found in LRO images by ASU (Arizona State University). The rover itself and the tracks are visible (2 white arrows) with a high resolution camera from orbit. The entire rover path over four months is also shown below.
Remote sensing images provide additional important information to the rover data.
Task:
1. Study the rover images (a)-(i) and the remote sensing images (j) and (k).
a. Describe the rover and the remote sensing images, what can be and cannot be observed?
b. Which conclusions can be drawn from the different imaging types (remote sensing vs. rover data)?
c. Explain the advantage of using rover data in combination with remote sensing data.
Week 7: Marine science: Real data collection for personal project.
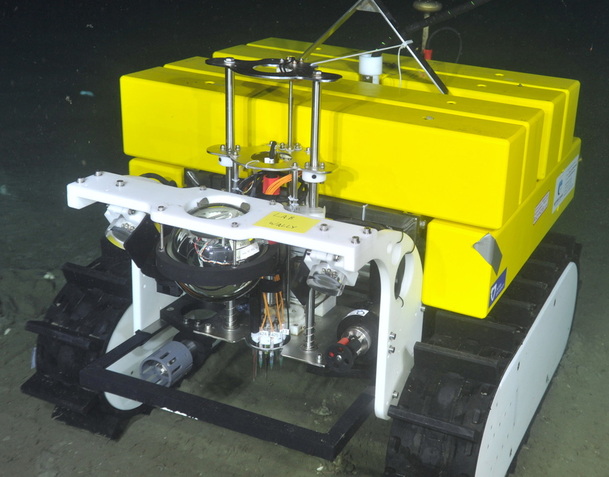
During this week you will have the chance to determine the scientific activities of the Jacobs University Bremen deep sea Crawler. You will be able, via the internet, to watch the Crawler carry out your designated tasks and direct the pilot via skype as required.
The Crawler is currently situated at a methane pockmark at ~890m depth in the Barkley Canyon, Pacific Canada. It has been monitoring this dynamic, extreme environment for almost 5 years and has collected the most extensive spatial and temporal set of data from such a location to date.
The Crawler is connected to the Ocean Networks Canada (ONC) cabled infrastructure - the worlds most extensive underwater science cabled network.
From the shallow waters of the Pacific coast down to the Cascadia Basin (2660 m) this network allows seismic sensors to detect tsunami waves and earthquakes in real-time, allowing the warning of coastal cities and facilities warning of approaching danger. This network supplies both power and two-way connectivity to many junction boxes and nodes on the seafloor, where further scientific equipment and sensors, such as the Jacobs University Bremen Crawler, can be attached.
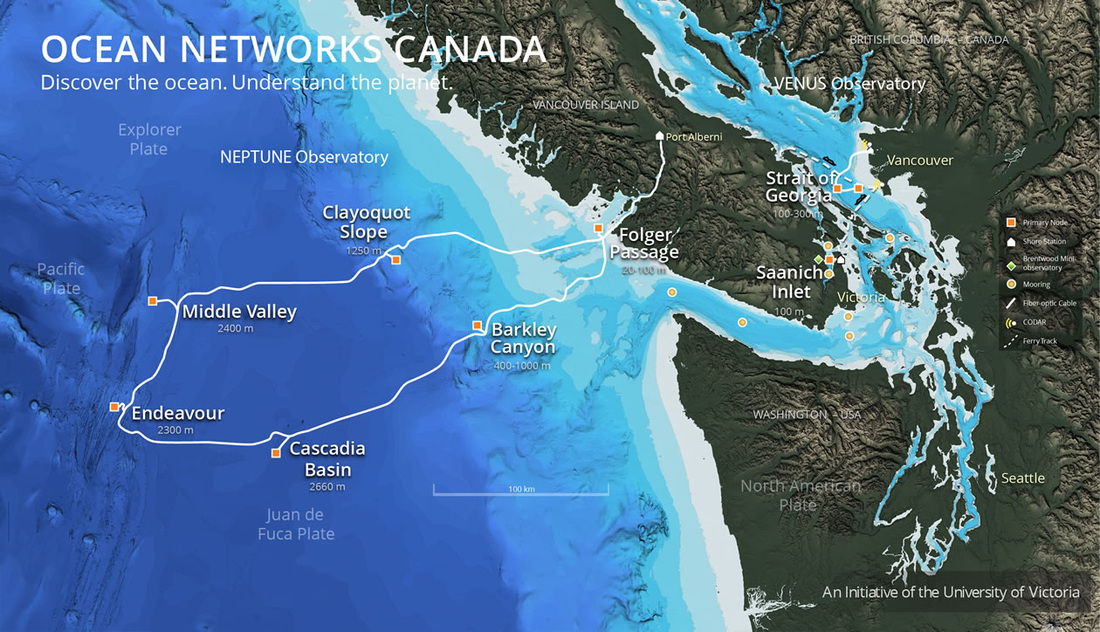
Current Ocean Networks Canada (ONC) Pacific cabled network. The Crawler is positioned at the Barkley Canyon node.
The Barkley Canyon location is dynamic in several ways :
1) It is an active canyon system allowing rapid transport of material from shallow coastal material to the deep sea.
2) The canyon is strongly seasonal, with both faunal abundance and environmental conditions varying throughout throughout the year.
3) There is active methane seepage from shallowly buried gas hydrate deposits. The rate of this seepage is likely influenced my pressure, temperature and possibly seawater flow velocity.
The Crawler capabilities and the Barkley Canyon deployment site are introduced in 'Purser_etal_2012.pdf' which may be downloaded from the resource page.
In this weeks study you will get the chance to plan one hours science at the site, during which you will be able to talk directly to the Crawler pilot and drive research. You should read the introductory paper and discuss with your tutor a plan for the scientific work to be conducted.
This weeks activities:
1. Download 'IASS_spring2016_Week7_mailout.pdf' from below and work through the documents tasks.
2. Download and read 'Purser_etal_2014.pdf' - this gives an overview of how the Crawler works and the location of deployment.
3. Think about what scientific study can be carried out with the Crawler during a 1 hour period. Discuss your ideas with the tutor via skype and email and come up with a work plan. Decide in combination with the tutor on a good time to carry out the investigation. Ideally the investigation should use one or more of the statistical tests introduced within this course. It could however combine some sort of sensor data with imaging data.
4. During the agreed time of the scientific work, watch alongside online as the Crawler carries out your scientific plan. Discuss over skype with the pilot (tutor!) any changes you think should be made during the mission.
5. After the mission, download data as required from the ONC website and carry out your statistical analysis.
Resources:
| planetary_week7.pdf |
| planetary_week7_refs.pdf |
| planetary_week7_task.pdf |