Week 1: 2nd - 8th Feb 2016
What is image analysis?
Week 1: What is imaging and analysis?
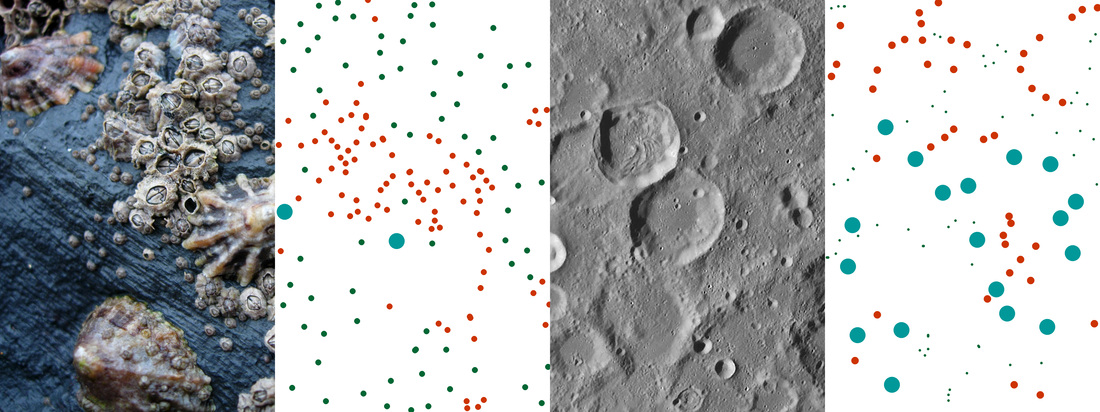
In all aspects of exploration and science, gathering images of locations, creatures or experiments are of paramount importance. Several hundred years ago travellers and botanists would record their distant observations in pen and ink, or on etching plates. With the advent of photography, then film, the volume and accuracy of their observations steadily increased. With the advent of the digital age, the amount of images which can be readily collected has soared again, with small computer chips being capable of storing vast quantities of images and video.
In the remote sensing of extreme environments, the facility to record images digitally, without the requirement of bulky film, and in huge numbers has opened up for study research topics that would have been impossible 50 years ago, and difficult even 10 years ago. In the deep sea for example, cameras with flash illumination can record images of the seabed hourly (or even less) all year round, with the data transferred to surface communication buoy directly, or collected periodically by visiting vessel. In space research, small, compact imaging devices on space probes and rovers can bring to the public fantastic panoramic views of distant planets, in huge detail, as well as capture close-up images of rocks and surface features for scientists.
The huge numbers of images which can now be collected from remote locations can be daunting to the investigator. In the past, when images of remote locations were rare, or much less abundant following a survey or sampling mission, scientists could pour over individual images to get the most out of them. Such diligence over individual images in data sets is now much more difficult, given the 1000s which can be generated swiftly by remote probes and survey vehicles, but the potential avenues for research are greatly broadened.
For many statistical tests, repeat, or replicate sampling is often required to ensure that trends in similarity or differences in populations between regions or over time evident from image are ‘real’ differences, rather than simply reflecting of local variance. New imaging technologies allow potentially 1000s of replicate images of, say, areas of different types of seabed to be taken quickly by underwater robot. With such large numbers of images, rigorous statistical analysis can try to identify, for example, if a particular type of fish is more common in one area of the seafloor than another. The applications, in all forms of environmental or exploration research, are near endless.
Week 1: Planetary Science: Obtaining planetary data, past to future (General introduction, short history of observations, overview about satellites, rovers, manned missions)
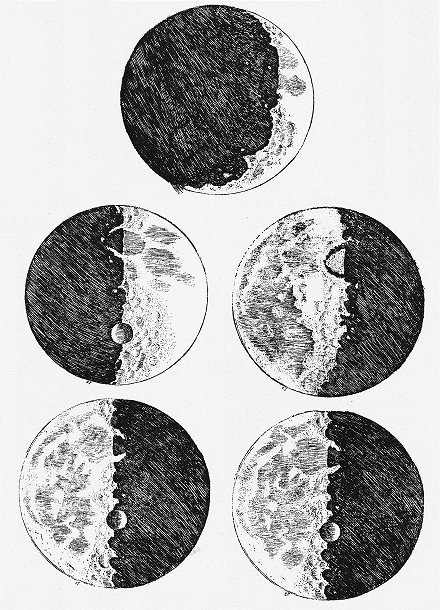
Galileo Galilei's drawings of the Moon.
|
The first planetary observations took place hundreds of years ago. Simple telescopes were used to explore the night sky. Differences between stars and planets were recognized quickly. The meaning and understanding of the planetary orbits came much later. Galileo Galilei drew one of the first lunar maps, based on his telescope observations (Fig.1). In the 17th century certain regions on the map got their names. Dark areas were interpreted as lunar oceans (mare) and bright regions as continents (terra). We kept the names of the regions and craters until today.
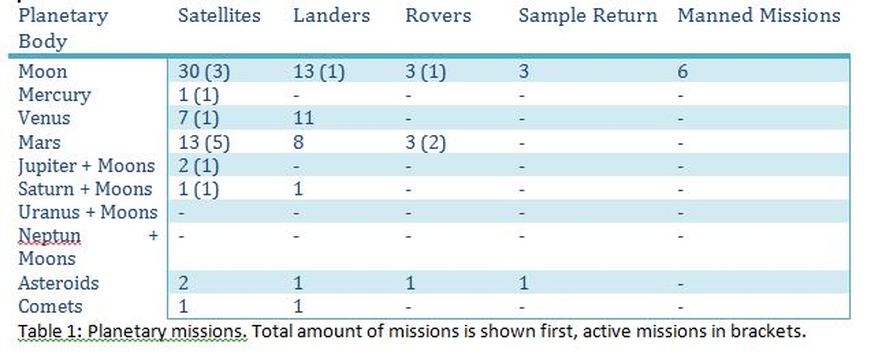
Since then many things changed. Not only do we have telescopes in orbit around Earth, we also send satellites to planets, moons and even asteroids and comets in our solar system. The satellites have various instruments on board that allow detailed observations of surfaces and atmospheres. The satellites provide much better observations than telescopes on Earth. Additionally, we also landed on different planetary bodies (Tab.1). This includes Moon, Mars, Titan, Asteroids, and Comets. The landers give further information about the atmosphere (if present) and in situ measurements of the surface (e.g. wind speed, temperatures, and chemical abundances). The disadvantage of landers is their limitation to the landing site. Rovers are mobile robots, which have the ability to move and cover a much larger area than immobile landers do. Unfortunately, rover missions are very expensive and technically (hardware and software) challenging (Tab.1). Due to the large distance and therefore long sending time from Earth the rovers have to perform automatically. Rover missions have a lot of advantages as they can collect huge amounts of data at different places of the surface. Some even have the ability to drill and dig into the surface, collect samples and analyse them (e.g. Curiosity on Mars). They can operate long times, resist cold nights and hot days and are only dependent on their battery life or power supply. Even though the rovers can drive decently fast, they usually do not. It takes rovers often months to cover a distance of a few hundred meters. Scientists analyse the images on the way and try to find the most interesting but also safest way for the rover. Often these two do not match, which results in discussions about the optimal rover path. |
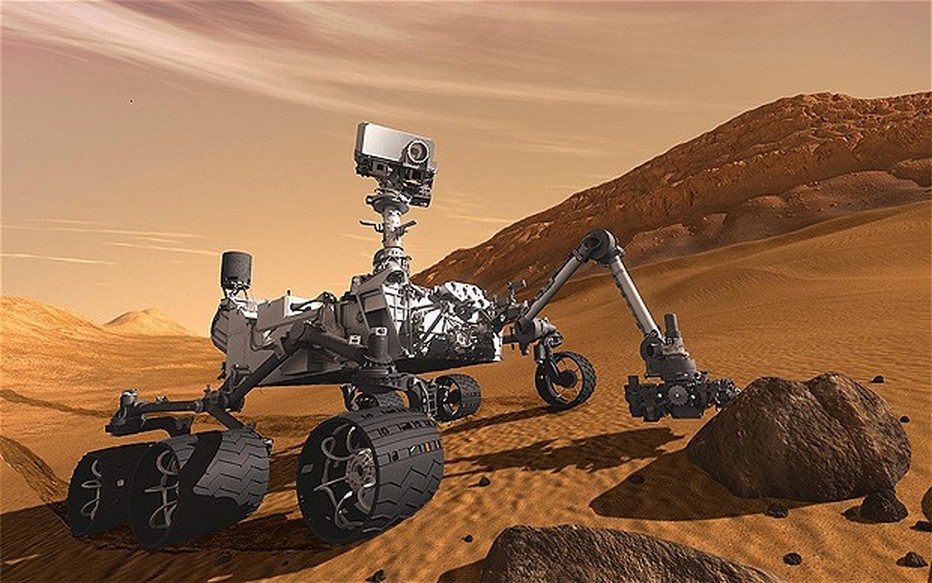
The rover 'Curiosity' on Mars.
A solution to avoid these problems is sending humans. They are more flexible in their decisions, faster, and more efficient in finding and collecting interesting samples. Of course manned missions are also more expensive, difficult, and dangerous. The only planetary body where humans have ever been except Earth is the Moon. From 1969 to 1972 12 people landed in 6 missions on the Moon (Tab.1). The technical and scientific achievements of these missions are outstanding. A manned mission to Mars is being discussed for many years now. We already have detailed plans for a Mars base or a one way trip to our neighbour planet.
Week 1: Marine Science: A brief history and overview of Marine imaging technologies
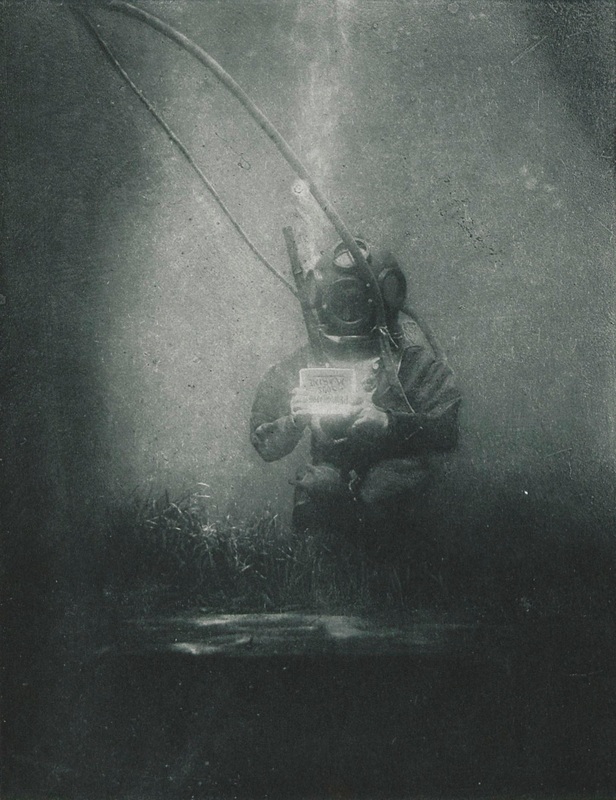
With each development in camera technologies, applications underwater have followed. Some of the earliest underwater images were taken in the vicinity of the Banyuls-sur-Mer field station in France, at the end of the 19th century, such as this portrait image of the Romanian scientist Emil Racoviță:
With each development in camera technologies, applications underwater have followed. Some of the earliest underwater images were taken in the vicinity of the Banyuls-sur-Mer field station in France, at the end of the 19th century, such as this portrait image of the Romanian scientist Emil Racoviță:
This weeks activities:
1. Register for the IASS FORUM below. this is where you will record what you take from the readings, add to your fellow learner's work and critically appraise each other's entries. Between weeks 2-4, you should make at least 3 entries each of 300 words. Take this opportunity to explore and share further readings, feel free to begin new pages, add multimedia content, video clips or whatever resources you feel would broaden the groups' understanding of these issues.
2. Download and read the 'iass_spring2016_space1' .pdf from below (and the associated 'refs' file if interested).
3. Download and read 'iass_spring2016_marine1.pdf' from below.
4. As instructed in the 'iass_spring2016_marine1.pdf' , please download and install the appropriate version of the 'Papara(ZZ)i' software from : https://github.com/PAPARA-ZZ-I/PAPARA-ZZ-I/tree/master/PAPARA%28ZZ%29I_installers
NB When downloading and installing 'Papara(ZZ)i' , if you use Avast! antivirus you may need to disable this to install correctly. You will need to reboot your PC after installing for the programme to work.
5. Download the 'Papara(ZZ)i' V1.8 manual here: https://github.com/PAPARA-ZZ-I/PAPARA-ZZ-I
6. Do research on upcoming Moon and Mars missions. Take a note of mission start dates, durations, involved countries and mission goals. Enter some information on these into the IASS Course Wiki.
Resources:
| iass_spring2016_welcome.pdf |
| iass_spring2016_space1.pdf |
| iass_spring2016_space1_refs.pdf |
| iass_spring2016_marine1.pdf |