Week 5: 25th April - 1st May
Planetary science: Geomorphological mapping
Marine science: Video transect data logging
Week 5: Planetary data: Geomorphological Mapping
Geological mappings were created on paper decades ago. Digital mapping gets more and more common and new software products are available for the special needs of mappers. The commercial product ArcGIS and the free open source GIS JMARS are recommended here. For our projects we will use the JMARS software.
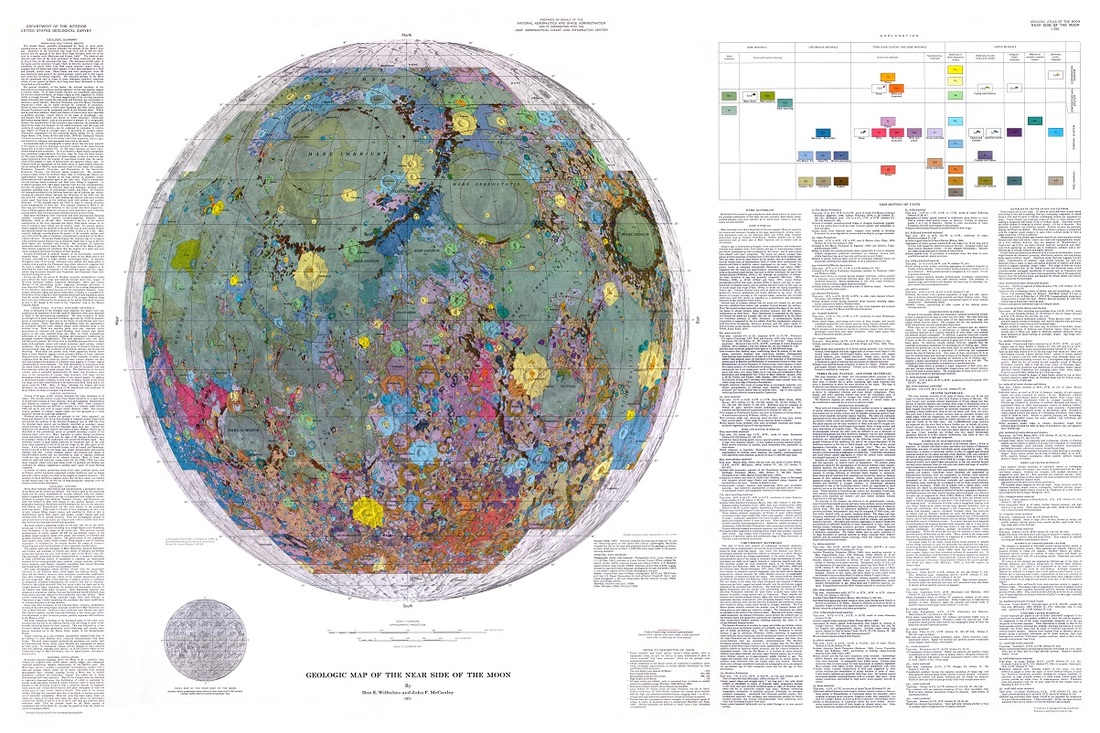
Planetary maps help to categorize a surface of a planetary body. Small regions are often mapped in high detail and high resolution. There are also global mappings available; the level of detail has to be lower for such large mapping projects. Planetary maps divide surfaces in specific surface units, which are represented in polygons, lines, or point features. All features need to be clearly identifiable within a map. The following characteristics help to make maps more meaningful:
Ø Color
Ø Texture
Ø Transparency
Ø Size
Ø Shape
Ø Quantity
Ø Orientation
Symbols for planetary mapping are available in the FGDC Digital Cartographic Standard for Geologic Map Symbolization by the USGS (http://ngmdb.usgs.gov/fgdc_gds/geolsymstd/download.php or PDF at downloads). Take a look at the PDF to get an idea for symbols for your own mapping. Please note that JMARS might not provide advanced symbols. Keep symbols for your map simple but as meaningful as possible.
Here we will focus on the Moon. Mapping out regions or certain surface features will help you to understand involved geologic processes and therefore, the history of the Moon.
This weeks activities:
1. Download 'IASS_spring2016_Week5_mailout.pdf' from below and work through the documents tasks.
2. Use JMARS for Moon to map out the bright and dark regions on the Moon.
a) Look at the different units in detail and characterize them.
b) How much of the Moon can be classified in bright and dark areas (in km2 and percentage)?
c) Save a snapshot of your mapped layer(s).
3. Map the region within the coordinates: N: 2.92, W: 16.41, E: 24.98, S: -2.02 or use the JMARS template provided in downloads (you need all files, but open/load only the .shp within a Custom Shape Layer in JMARS). You can also find an example mapping in downloads.
a) Which dataset and resolution did you use for mapping and why?
b) How many different surface units did you map out (at least 6 points, lines, or polygons)?
c) Name and give characteristics for every unit type that you mapped.
d) Discuss possible problems and disadvantages of this analyzing method (hint: reliability, objectivity, truth, consistency).
e) Save a snapshot of your mapping.
Hint: Save the mapping as shapefiles in JMARS, you will need it for later tasks!
Download: Coordinates for Mapping Area, Guide 2.1 for Example Mapping, PDF for FGDC symbols
Geological mappings were created on paper decades ago. Digital mapping gets more and more common and new software products are available for the special needs of mappers. The commercial product ArcGIS and the free open source GIS JMARS are recommended here. For our projects we will use the JMARS software.
Planetary maps help to categorize a surface of a planetary body. Small regions are often mapped in high detail and high resolution. There are also global mappings available; the level of detail has to be lower for such large mapping projects. Planetary maps divide surfaces in specific surface units, which are represented in polygons, lines, or point features. All features need to be clearly identifiable within a map. The following characteristics help to make maps more meaningful:
Ø Color
Ø Texture
Ø Transparency
Ø Size
Ø Shape
Ø Quantity
Ø Orientation
Symbols for planetary mapping are available in the FGDC Digital Cartographic Standard for Geologic Map Symbolization by the USGS (http://ngmdb.usgs.gov/fgdc_gds/geolsymstd/download.php or PDF at downloads). Take a look at the PDF to get an idea for symbols for your own mapping. Please note that JMARS might not provide advanced symbols. Keep symbols for your map simple but as meaningful as possible.
Here we will focus on the Moon. Mapping out regions or certain surface features will help you to understand involved geologic processes and therefore, the history of the Moon.
This weeks activities:
1. Download 'IASS_spring2016_Week5_mailout.pdf' from below and work through the documents tasks.
2. Use JMARS for Moon to map out the bright and dark regions on the Moon.
a) Look at the different units in detail and characterize them.
b) How much of the Moon can be classified in bright and dark areas (in km2 and percentage)?
c) Save a snapshot of your mapped layer(s).
3. Map the region within the coordinates: N: 2.92, W: 16.41, E: 24.98, S: -2.02 or use the JMARS template provided in downloads (you need all files, but open/load only the .shp within a Custom Shape Layer in JMARS). You can also find an example mapping in downloads.
a) Which dataset and resolution did you use for mapping and why?
b) How many different surface units did you map out (at least 6 points, lines, or polygons)?
c) Name and give characteristics for every unit type that you mapped.
d) Discuss possible problems and disadvantages of this analyzing method (hint: reliability, objectivity, truth, consistency).
e) Save a snapshot of your mapping.
Hint: Save the mapping as shapefiles in JMARS, you will need it for later tasks!
Download: Coordinates for Mapping Area, Guide 2.1 for Example Mapping, PDF for FGDC symbols
Resources:
| jmars_mapping__guide.pdf |
| planetary_week5a.pdf |
| planetary_week5b.pdf |
| planetary_week5_refs.pdf |
| 2.1_mapping_region1_outlines.csv |
| cross_sections.pdf |