Week 2: 8th - 15th Feb 2016
Planetary science: Different Imaging systems and image archives
Marine science: Generating numerical data from images using 'Papara(ZZ)i'
Planetary and Marine Sciences: Introduction to 'ImageJ'
Week 2: Planetary Science: Different types of planetary image data: Radar, Camera, Stereo, Spectrometer
Image data can be classified into remote sensing, aerial photography, and in situ data. Remote sensing offers the identification of objects and the analysis of dynamic surface processes. The quality of digital data has dramatically improved over the last decades because of increased geometric, temporal, spatial, radiometric and spectral resolution. Even for Earth observations remote sensing is of prime importance. A global view provides new insights and information about short and long term changes of planets. Such images are obtained from surfaces, satellite, aerial and ground platforms. For planetary research mainly satellite platforms are available. Rover and lander missions to planetary bodies provide in site or ground truth data only for specific sites. Therefore, the obtained remote sensing data need to be reliable and of high quality. Spacecraft orbiting planetary bodies in a certain distance allow observation of surface, atmospheres, gravity, and radiation parameters by various instruments. Each instrument and sensor focus on a specific topic, developed for answering a certain research question. Separately collected information needs to be taken together to obtain a complete dataset. This needs to be analyzed to investigate surface processes and conditions of planetary bodies. Remote sensing does not collect direct information about the environment of planetary bodies. Instead it provides unique electromagnetic values, that need to be converted and processed further to obtain information on object identification, object properties and spatial arrangements.
Every object on a planet scatters, absorbs or reflects solar radiation and emits thermal radiation in a characteristic way according to the chemical, structural and chromatic properties of the object. These radiation principles are used by various instruments. They are operating in the optical reflected and emitted wavelengths, characterized by different spectral intervals. The spectrum ranges from ultraviolet to microwave. Each band is used to study different surface features.
Important for remote sensing images is the resolution, also called Level of Detail (LoD). Remote sensing systems have spectral, spatial, temporal, radiometric and geometrical resolution.
1. Spectral resolution is the sensor capability to resolve details in the spectral signal by the energy measured within each spectral band of the sensor. If the spectral resolution is too low important information about spectra characteristics are lost, resulting in potential misinterpretation of object composition and properties.
2. Spatial resolution is often equated to the field of view (FOV). It is defined as the area on the ground which is viewed by the instrument. This area depends on the altitude of the spacecraft and varies by decreasing or increasing orbit altitude. Depending on the type of research different resolutions are essential. High resolution is useful for detailed surface observations. Low resolution is sufficient for conducting global research.
3. Temporal resolution defines how often the same area is captured by a sensor. It is essential for the observation and analysis of dynamic systems (e.g. atmosphere) and for detecting surface changes (e.g. liquid water).
4. Radiometric resolution or sensitivity depends on the amount of digital numbers (DN), which are recorded by the sensor of an instrument. These numbers are representing different grey values. More surface details are visible if the DN is high. The radiometric resolution is usually given in bits (4 bits = 64 grey levels, 8 bits = 256 grey levels, 16 bits = 1064 grey levels).
5. Geometric Resolution is defined by the ground size of the pixels.
The resolution can vary from centimeters to kilometers, based on the sensor, orbit and type of observation. High resolution allows observing more surface details, but is very time consuming. Low resolution helps to investigate global research by providing global coverage of data. Not all instruments achieve a global coverage of image data. Often regions are only partially covered.
In planetary science we often use image data of different instruments and resolutions to gain as many information about the area as possible. However, the different meaning and resolution of the data need to be taken into account.
More information about remote sensing and concepts of spatial, spectral, temporal and radiometric resolution is available in the following books:
M. Gomarasca (2004): Basics of Geomatics, Springer.
P. Mather & M. Koch (2011): Computer Processing of Remotely-Sensed Images: An introduction, Wiley.
M. Lemmens (2011): Geo-information: Technologies, Applications and the Environment, Springer.
Satellites orbiting a planetary body are equipped with several instruments (usually 3 to 10). Important instruments for lunar observations are listed in the following section. A good overview about lunar data sets can be seen on the webpage: http://pds-geosciences.wustl.edu/dataserv/moon.html
Some lunar missions:
LRO: Lunar Reconnaissance Orbiter launched in 2009 by NASA. The LRO instruments return new global data, such as day-night temperature maps, a global geodetic grid, high resolution color imaging and the moon's UV albedo. The mission provides new and the best regional and global high resolution maps. The spacecraft is still operating (http://lunar.gsfc.nasa.gov/). Instruments on LRO are:
o CRaTer: Cosmic Ray Telescope for the Effects of Radiation
o DLRE: Diviner Lunar Radiometer
o LAMP: Lyman Alpha Mapping Project
o LEND: Lunar Exploration Neutron Detector
o LOLA: Lunar Orbiter Laser Altimeter
o LROC: Lunar Reconnaissance Orbiter Camera- NAC/WAC: Narrow/Wide Angle Camera
Chandrayaan 1: launched in 2008 by the Indian Space Research Organization (ISRO). The mission ended in 2009 after loss of radio contact. Instruments are:
o Mini-RF: Synthetic Aperture Radar
o M3: Moon Mineralogy Mapper
Grail: Gravity Recovery and Interior Laboratory by NASA, launched in 2011. GRAIL was a twin spacecraft (Ebb and Flow) that were in tandem orbits around the moon for several months to measure the lunar gravity field in detail. The mission ended in 2012 with a controlled impact of the twin spacecraft on the Moon (http://www.nasa.gov/mission_pages/grail/main/index.html).
Clementine: The NASA mission took place 1991 to 1994 and provides the first base maps for the Moon. Gravity, topography, LIDAR, brightness, and temperature data were obtained.
Large amounts of data for the Moon exist and they can be obtained on NASA’s Planetary Data System (PDS) at http://pds.nasa.gov/. The page also provides information about all bodies in the solar system and the related data sets. Within that page the Geosciences Node from Washington University is available (http://ode.rsl.wustl.edu/moon/index.aspx). They archive the data related to the study of planetary surfaces. Useful links and a guide can be downloaded.
Week 2: Marine science: Generating numerical data from images using 'Papara(ZZ)i'
This week you will download and use the freely available ROBEX software 'Papara(ZZ)i' - a multiplatform tool useful for identifying features within image sets.
This week you will download and use the freely available ROBEX software 'Papara(ZZ)i' - a multiplatform tool useful for identifying features within image sets.
Week 2: Planetary and Marine Sciences: Introduction to 'ImageJ'
Determining the size and abundance of features in images is an essential step in many avenues of research. A very versitile, free, tool is 'ImageJ'. Get used to using this tool for both Planetary and Marine Images by following the instructions below:
Determining the size and abundance of features in images is an essential step in many avenues of research. A very versitile, free, tool is 'ImageJ'. Get used to using this tool for both Planetary and Marine Images by following the instructions below:
This week's activities:
1. Download and read 'IASS_Spring2016_space2.pdf', carryong out the tasks therein, and also download 'IASS_Spring2016_space2_planetarydatasets.pdf' to assist with the work.
2. Download and install 'Papara(ZZ)i' if you have not already done so, from : https://github.com/PAPARA-ZZ-I/PAPARA-ZZ-I
3. Download and read 'IASS_Spring2016_marine2.pdf' - work your way through this document and download all of the required files from those listed below.
4. Download the ImageJ User Guide (as downloadable pdf) and install the ImageJ software from the link below.
5. Download the 'iass_guidetoimagej_basic.docx' file and read it through. It gives an overview of the standard 'ImageJ' functions.
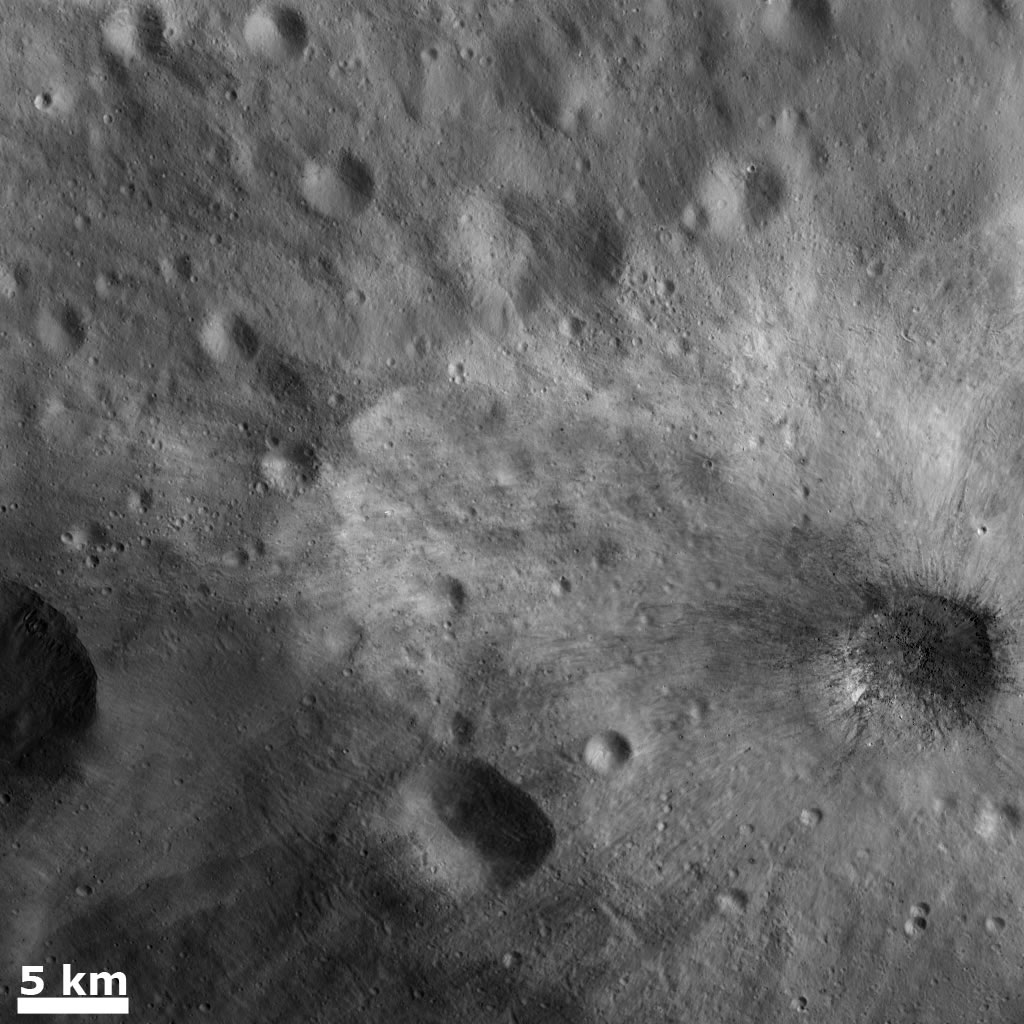
6. Download the 'Vestacrater.jpg' from below to work on with ImageJ, if you would like to do so. (IMAGE TITLE AND CREDIT:
A fresh 4.3 mile diameter crater on Vesta displays both bright and dark rays as well as blocks of debris (in its center) from the impact. Click to enlarge. Credit: NASA/ JPL-Caltech - See more at: http://astrobob.areavoices.com/2011/11/#sthash.EZlGhyLm.dpuf)
7. Go to one of the Moon data webpages and view/ download an image of your choice. Which instrument does it come from and which information is visible in the image. What is the location and resolution of the image? List this information on the course forum.
Resources:
ImageJ may be downloaded and installed here:
(http://rsb.info.nih.gov/ij/)
1. Download and read 'IASS_Spring2016_space2.pdf', carryong out the tasks therein, and also download 'IASS_Spring2016_space2_planetarydatasets.pdf' to assist with the work.
2. Download and install 'Papara(ZZ)i' if you have not already done so, from : https://github.com/PAPARA-ZZ-I/PAPARA-ZZ-I
3. Download and read 'IASS_Spring2016_marine2.pdf' - work your way through this document and download all of the required files from those listed below.
4. Download the ImageJ User Guide (as downloadable pdf) and install the ImageJ software from the link below.
5. Download the 'iass_guidetoimagej_basic.docx' file and read it through. It gives an overview of the standard 'ImageJ' functions.
6. Download the 'Vestacrater.jpg' from below to work on with ImageJ, if you would like to do so. (IMAGE TITLE AND CREDIT:
A fresh 4.3 mile diameter crater on Vesta displays both bright and dark rays as well as blocks of debris (in its center) from the impact. Click to enlarge. Credit: NASA/ JPL-Caltech - See more at: http://astrobob.areavoices.com/2011/11/#sthash.EZlGhyLm.dpuf)
7. Go to one of the Moon data webpages and view/ download an image of your choice. Which instrument does it come from and which information is visible in the image. What is the location and resolution of the image? List this information on the course forum.
Resources:
ImageJ may be downloaded and installed here:
(http://rsb.info.nih.gov/ij/)
| iass_spring2016_space2.pdf |
| iass_spring2016_space2_planetarydatasets.pdf |
| iass_spring2016_marine2.pdf |
| so242-2-shortreport.pdf |
| bluhm_2001.pdf |
| iass_week2_discolfaunaguide.pdf |
| iass_week2_discol_listofkeywords.txt |
| track_-_35.zip |
| nontrack_-_35.zip |
| iass_guidetoimagej_basic.docx |
| vestacrater.jpg |