Week 4: 18th - 24th April
Planetary science: Planetary GIS data
Marine science: ANOVA comparisons
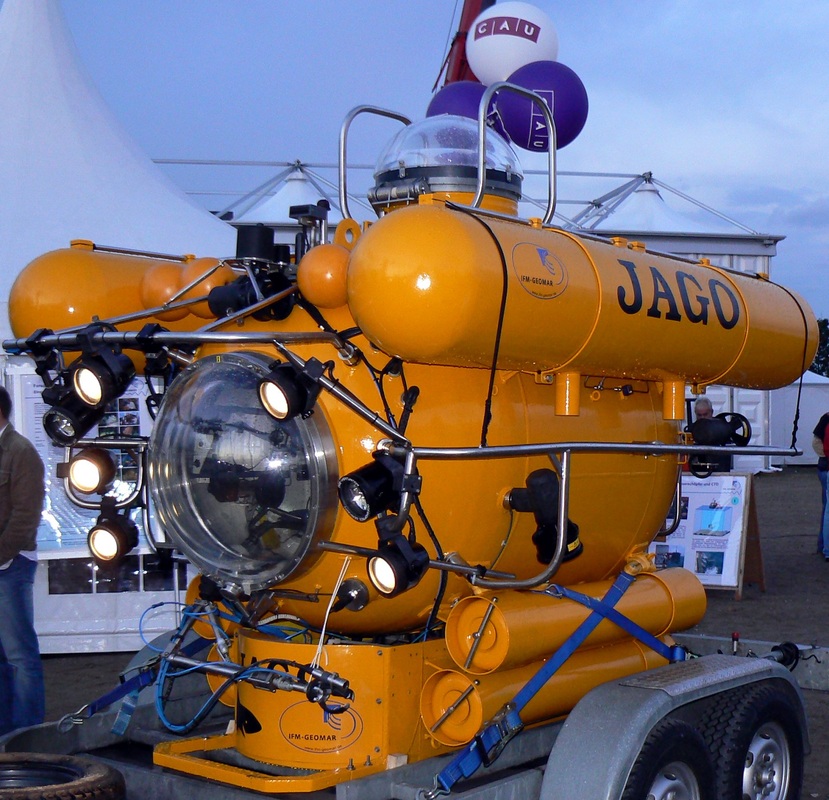
JAGO manned submersible, operated by Geomar ROBEX partners.
Click HERE to read more about this useful vehicle.
Click HERE to read more about this useful vehicle.
(see DOWeek 4: Planetary data: Analysis of planetary images remote sensing and rover data
A geographical information system (GIS) is software for the management and manipulation of geographical information. This term describes a system to process data that have a georeferenced and therefore, defined position in terms of coordinates. Several definitions can be found in the literature, they all refer to a GIS as a powerful software including tools to capture, manage, store and present spatial data. Images of different resolution, reference system and projection can be included and adapted to each other in the GIS. The combination of various spatial datasets allows a geoscientific analysis and interpretation. It was originally developed to improve the analysis and interpretation of Earth data, but it can be also adapted to other planetary bodies. Consequently a GIS is a powerful tool for planetary data analysis.
Planetary missions collect large amount of image data by using remote sensing techniques. Every day we receive new data from various planets, moons and asteroids in our solar system. Depending on the resolution high coverage of the surface is available. Overlapping image segments can occur and give more information about short term surface processes. A GIS provides several tools for planetary mapping. The tools allow measuring and calculating various parameters within the digital images. It is also possible to include or develop new tools that are needed to fulfill specific measurements or calculations. Furthermore, geologic mappings, cross-sections, spatial and attribute queries can be conducted within the GIS, by using georeferenced data.
Several GIS software products are available. They all follow the same purpose, but differ in aspects like quality and amount of analyses tools, or reference system. The following products are examples for free software that is available for working with digital planetary data sets:
Ø JMARS (jmars.asu.edu, Mars, Moon, Earth)
Ø Quantum GIS (qgis.org/)
Ø GRASS (grass.itc.it/)
There are also commercial ones that are used frequently:
Ø ArcGIS (www.esri.com)
Ø Global Mapper (www.globalmapper.com)
Ø Integraph (www.intergraph.com)
The software ArcGIS is developed by ESRI and represents a commonly used and advanced GIS. It is used by a large community, mainly focusing on Earth science. ArcGIS presents a program with hundreds of tools for geoscientific research and also the possibilities to create and adapt the tools to the user’s needs. It also supports various programing languages to allow enhanced research. DataBase Management Systems (DBMS) are also available and provide additional support in building and managing databases. ArcGIS can be used for database generation and coding for obtaining attribute and spatial classifications. It is rather complicated software that is not open source. To use planetary data within this GIS data processing of the obtained data sets is required. It can be listed in five steps:
1. Web-based dataset search (e.g. PDS)
2. Selection of needed image data, including download
3. Processing and combination of individual images to form mosaics (to change data types)
4. Adapting all data to one reference system to ensure comparability and combination of data
5. Import into a GIS that allows analysis and interpretation of data
That is the usual procedure planetary scientists use to obtain the data before they can start the analysis and interpretation.
Here we want to introduce an open source GIS called JMARS. JMARS is an acronym and stands for Java Mission- planning and Analysis for Remote Sensing. It was developed by the Mars Space Flight Facility at the Arizona State University (ASU). Despite the name, JMARS is also available for other planetary bodies (Moon, Earth, Mercury,…), but was originally developed for the planet Mars. It provides access to free image data obtained by various missions. These image data do not need to be processed, regarding file format and projection, by the user. The images can be loaded directly into the GIS. Multiple data sets can be loaded and compared within JMARS. Simple mapping operations and attribute analyses can be also conducted by using scripting in the Structured Query Language (SQL). JMARS can be used for global observations and characterizations, including measurements and calculations, of surface features on the Moon.
JMARS can be downloaded here: http://jmars.asu.edu/download
Documentation and further information are available here: http://jmars.asu.edu/
Tutorials can be found here: http://jmars.asu.edu/jmars-tutorials
Not only digital images are the foundation for planetary research. Databases are of high importance, too. Databases are organized computer-based collections of data that allow the management of these data including insertion, modification, retrieval, and deletion of data. A database is always an abstract representation of the real world and hence can never contain all elements of the real world. Nevertheless, they provide organized and structured data and yield the following advantages:
1. Reliability: consistent services without interruptions are provided.
2. Correctness and Consistency: the internal logic is proofed and correct.
3. Technology: database software is independent to the system and not effected by e.g. updates.
4. Security: protection against loss and unauthorized read is guaranteed.
On Earth thousands of different databases exist and are available online. However, the amount of databases for other planetary bodies is small. Already existing databases help scientists to focus more on the analysis of the surface data. Often analysis starts with a geological and/or geomorphological mapping. Different surface units in an area are identified and separated from each other. This can be done based on mineralogy, which would be a geological mapping, or based on surface features that results in a geomorphological mapping. Other methods include stratigraphy and geological profiles. They are used to identify the order in which different events could have happened. A very important method to analyze the surface age is the crater size frequency distribution and crater counting. All these methods will be explained in detail later during this class. You will also try to use these methods to analyze the lunar surface. Comparative studies are common for surface analysis. Features from other planetary bodies get compared to each other or to similar features on Earth. All we know about geology and geomorphology did we learn based on Earth processes and materials. It is natural for us to compare our observations in the solar system with features we know from our planet. Comparative studies are not easy to conduct, due to big differences in the prevailing environments in the solar system. However, they give us an idea about possible processes and past environments on other planetary bodies.
Of course there are more analyzing methods in planetary science. Many projects about automated feature recognition, classifications, and decision making get funded. Progress has been made in the last years and new methods and better techniques will be established in the future.
Week 4: Marine data: ANOVA data comparisons:
This weeks activities:
1. Download 'IASS_spring2016_Week4_mailout.pdf' from below and work through the documents tasks.
2. Download and Install JMARS (for Moon) - link BELOW.
3. Find the impact crater Dionysius on the Moon. Measure the diameter, depth, and coordinates of the crater. Save a snapshot of Dionysius in JMARS.
4. Find the landing site of Apollo 17. List the coordinates and describe the region they landed in. Save a snapshot of the landing site in JMARS.
Hint: Try to use data sets with a high resolution (see 1.2).
Download link:
JMARS (http://jmars.asu.edu/download), Guide for JMARS
Resources:
| planetard_week4.pdf |
| planetary_week4_refs.pdf |
| gisjmars.pdf |